
All tools
Calculator
Break-Even Point
Break-even units, revenue and months to profitability – based on your fixed costs and unit economics.
Your costs
Result
Break-even units / mo
1,171
Break-even revenue / mo
€87,766
Contribution / unit
€47
62.7% margin
Months to break-even
8 mo
If contribution per unit is negative, no volume will save you – fix price or variable cost first. Cash break-even (with inventory and payment timing) usually lands 20–40% higher than accounting break-even.
Client reviews
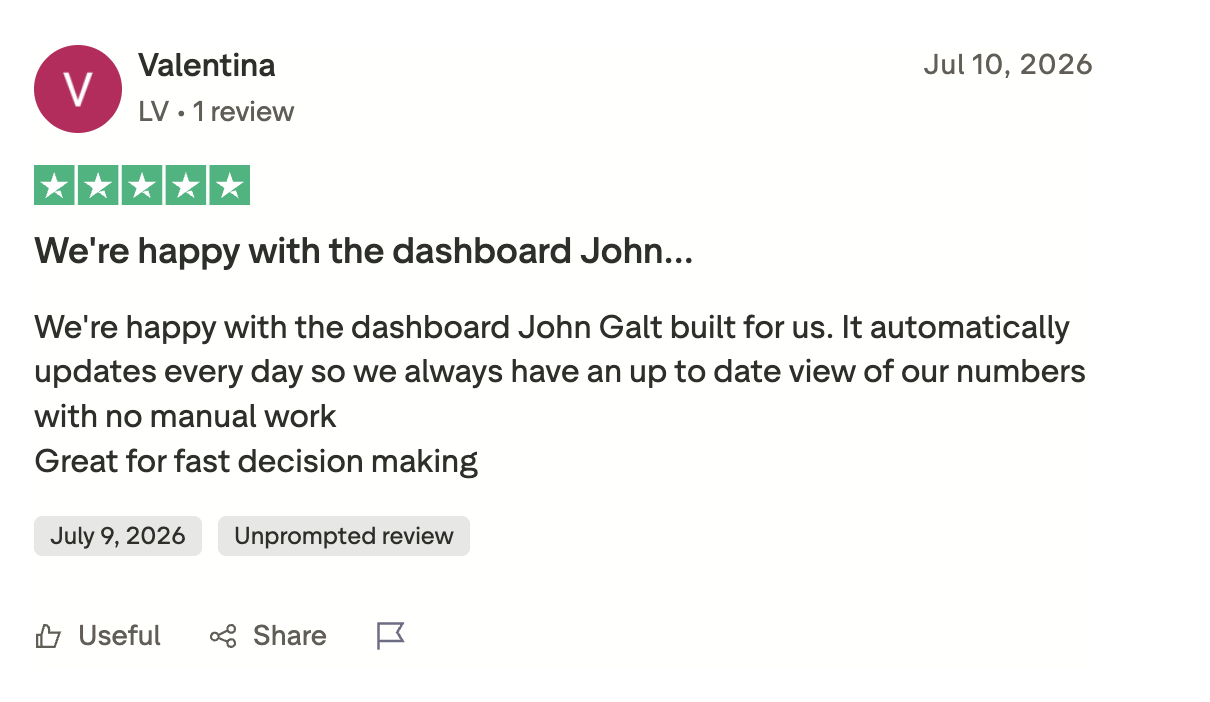
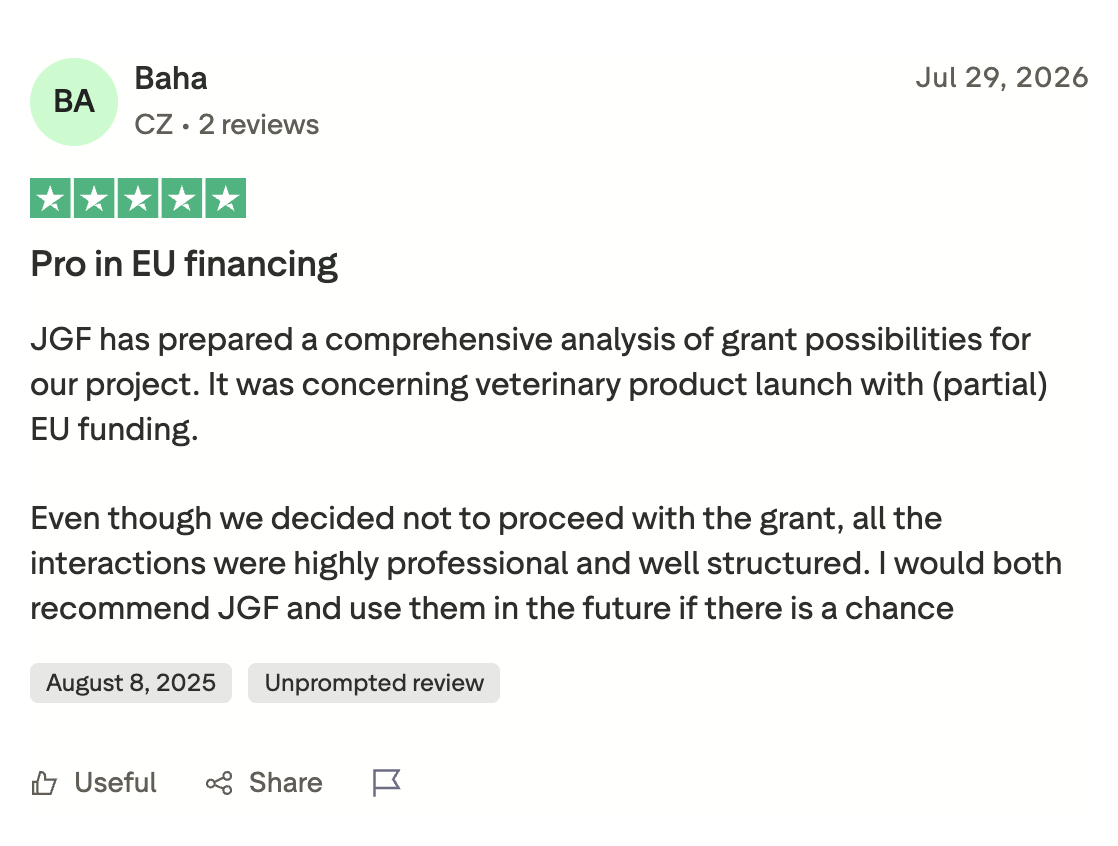
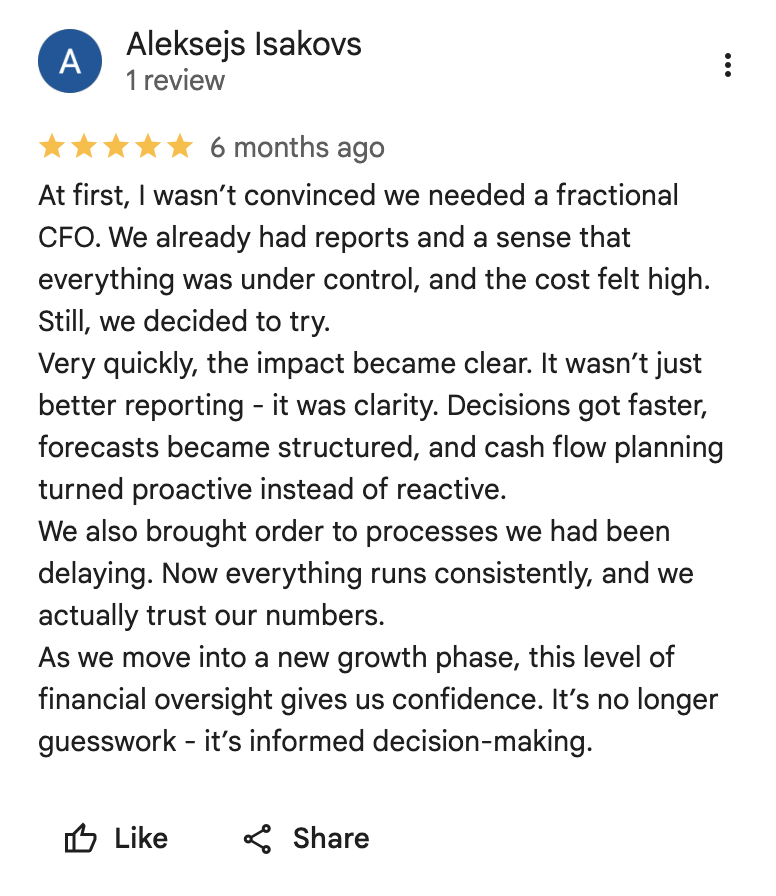
What our clients actually say.














Want a real cash break-even with seasonality?
A free 30-minute call – we'll model your actual cash break-even including inventory cycles.
30 min · No pitch · A real CFO, not a chatbot