
Know exactly which products actually make you money.
Most DTC and marketplace brands have 15–25% of SKUs quietly losing money once every cost is loaded in. We surface the truth and turn it into pricing, marketing and inventory decisions – usually in 2–3 weeks. Pairs with our Management Reporting engagement.
30 min · No pitch · A real CFO, not a chatbot
Who it's for
- DTC brands $1M–$20M with 20+ SKUs and ad spend over $30K/month.
- Multi-channel sellers (Shopify + Amazon + wholesale) where allocation is unclear.
- Brands planning a raise or sale that need investor-ready unit economics by SKU.
Symptoms you need this
If more than two of these sound familiar, this is the service to start with.
What you get
9 cost layers: net price, landed COGS, 3PL, shipping, payment fees, returns, ad allocation, platform fees, overhead.
Top and bottom performers by true contribution, with kill/reprice/double-down flags.
The lowest price each SKU can be promoted at without going below break-even.
Inventory velocity crossed with contribution – see where cash is trapped.
Same SKU, comparable P&Ls across Shopify, Amazon and wholesale.
Automated update your team runs after month-end close.
- Data extraction from Shopify, Amazon, 3PL, ad platforms and bookkeeping
- 9-layer cost model built to your channel mix
- Per-SKU contribution table with recommendations
- Discount policy and kill-list workshop
- Handover of the live dashboard (Google Sheets or Lightdash)
- 30-day support to action the first wave of decisions
- Monthly bookkeeping / accounting close (ask about Management Reporting)
- PPC campaign management or creative production
- Amazon FBA reimbursement filing (referred to specialist partners)
- Tax planning or filing
How it runs
90 days of orders, COGS, 3PL, ads and payment data extracted and normalised.
Build the 9-layer cost model and per-SKU allocation logic.
Deliver the ranked SKU table with discount floors and recommendations.
Workshop with founders to action prices, kills and ad reallocations.
Artifacts we deliver
Sortable Sheets/Excel file with 9 cost columns and net contribution per SKU.
Per-SKU minimum promo price to stay contribution-positive.
Same SKU across Shopify, Amazon and wholesale, comparable P&L.
Step-by-step doc so your team keeps the dashboard live monthly.



This is an e-commerce-specific analysis package. For end-to-end monthly reporting, pair it with our Management Reporting service.
Check your numbers first
SKU profitability FAQ
What is true SKU profitability?+
It is the contribution each product leaves after every variable cost is loaded in: landed COGS, 3PL, shipping, payment fees, returns, platform fees, allocated ad spend and a share of overhead. Gross margin alone hides most of these.
How long does the analysis take?+
Usually 2–3 weeks: one week to pull and clean the data, one to build the cost model and ranked table, and a final decisions workshop.
What data do you need from us?+
Around 90 days of orders, COGS or supplier invoices, 3PL and shipping bills, ad platform spend, payment processor fees and your bookkeeping export. Read-only access is enough.
Does it work for Amazon and multi-channel sellers?+
Yes. We build comparable P&Ls for the same SKU across Shopify, Amazon and wholesale, so channel decisions are based on like-for-like numbers.
What happens after the first analysis?+
You get a live dashboard and a refresh runbook so your team can update it after each month-end close. We also support you for 30 days while you act on the first decisions.
Can I check my numbers before booking a call?+
Yes. Start with our guide on calculating true SKU profitability and the break-even and True ROAS calculators linked on this page.
Related answers and services
The questions founders ask about this work, and the neighbouring services.
- Serviceunit economics workFully loaded margin per unit, channel and cohort.
- Guidefractional CFO for e-commerceSKU margin, true ROAS and cash tied up in stock.
- GuideSKU profitability analysis guideStep-by-step contribution margin per SKU, with a worked five-SKU example.
- Servicemarketplace financeAmazon and marketplace fees, payouts and true margin.
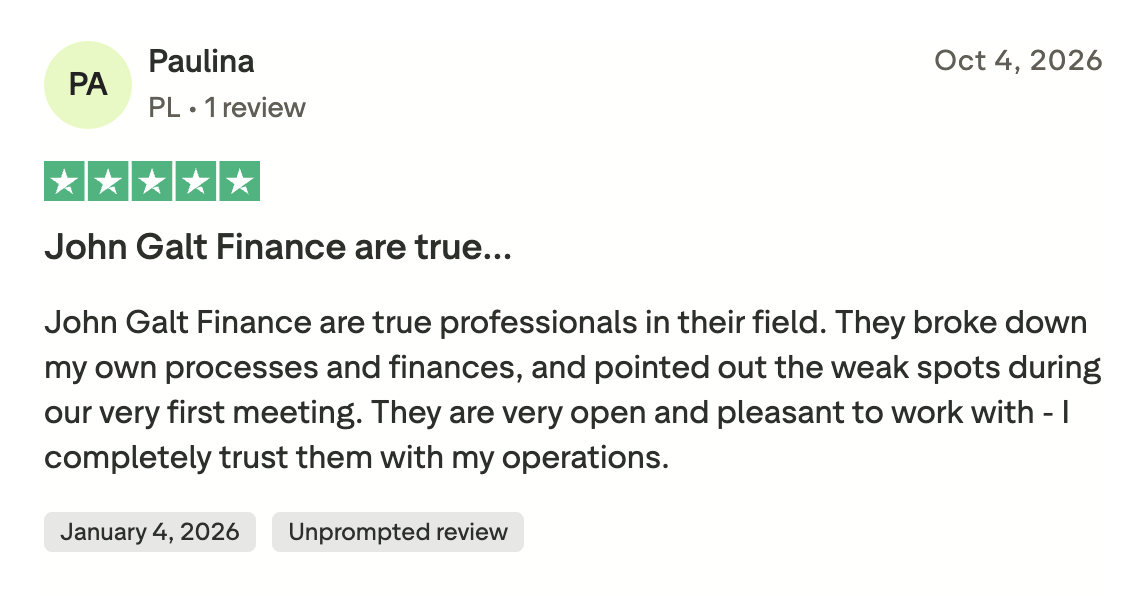
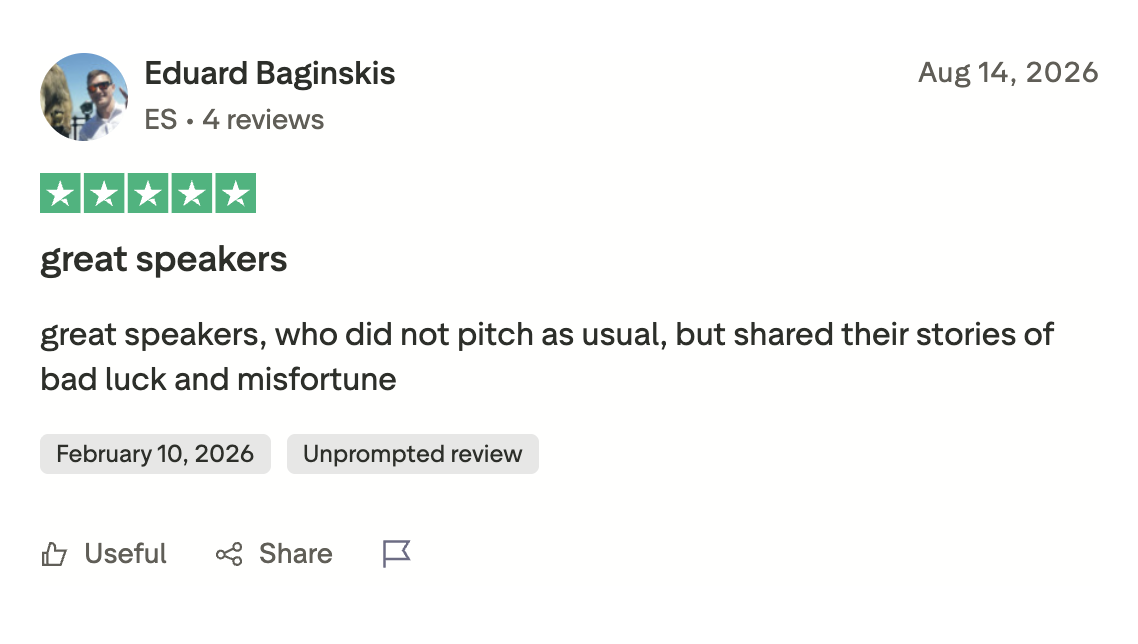
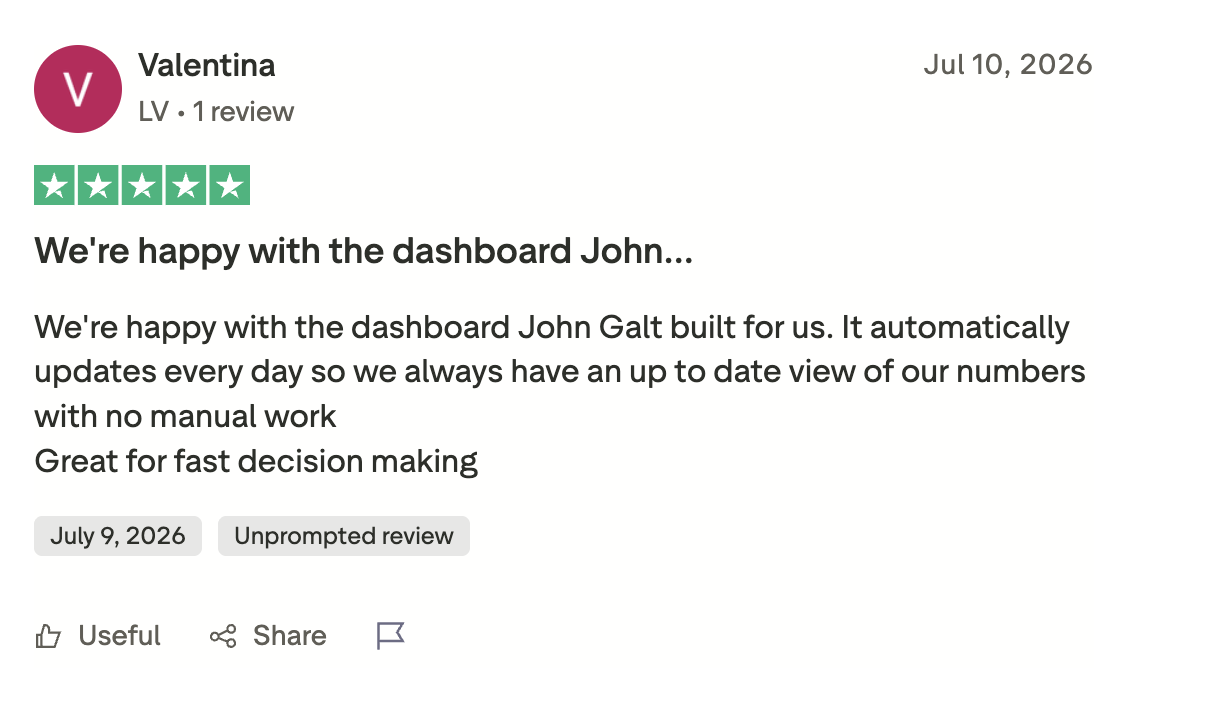
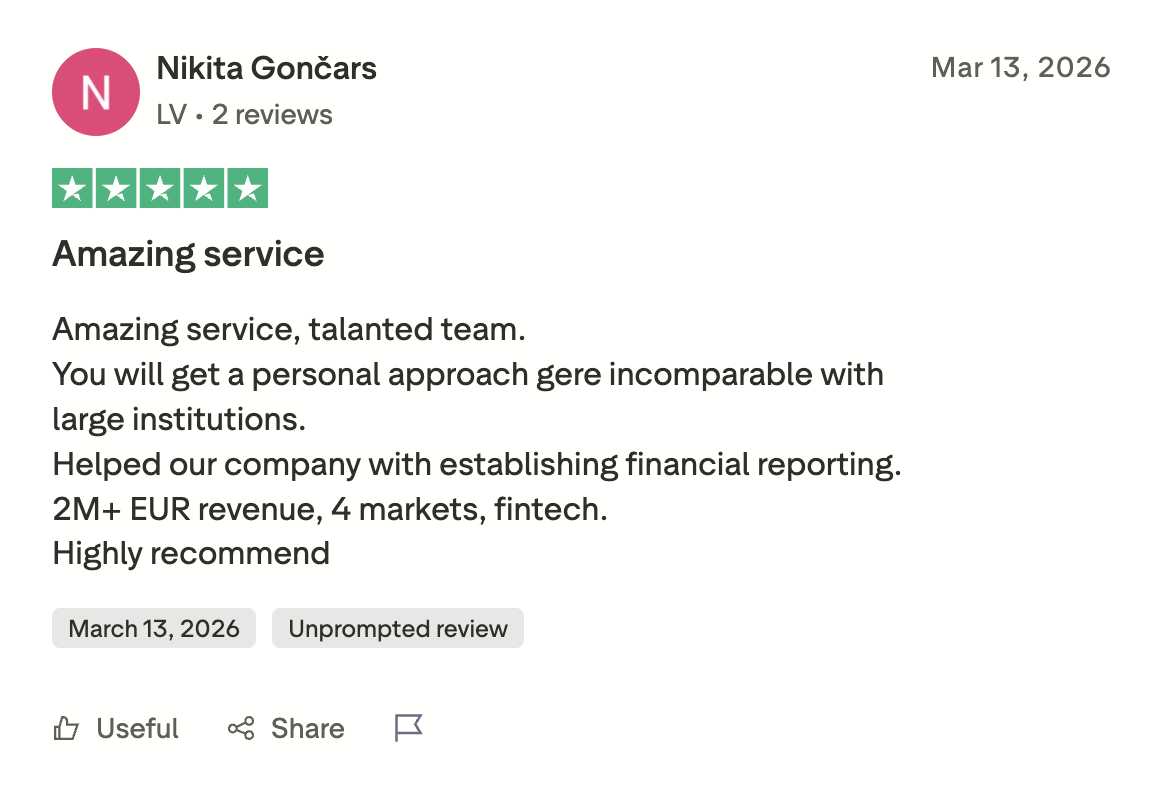
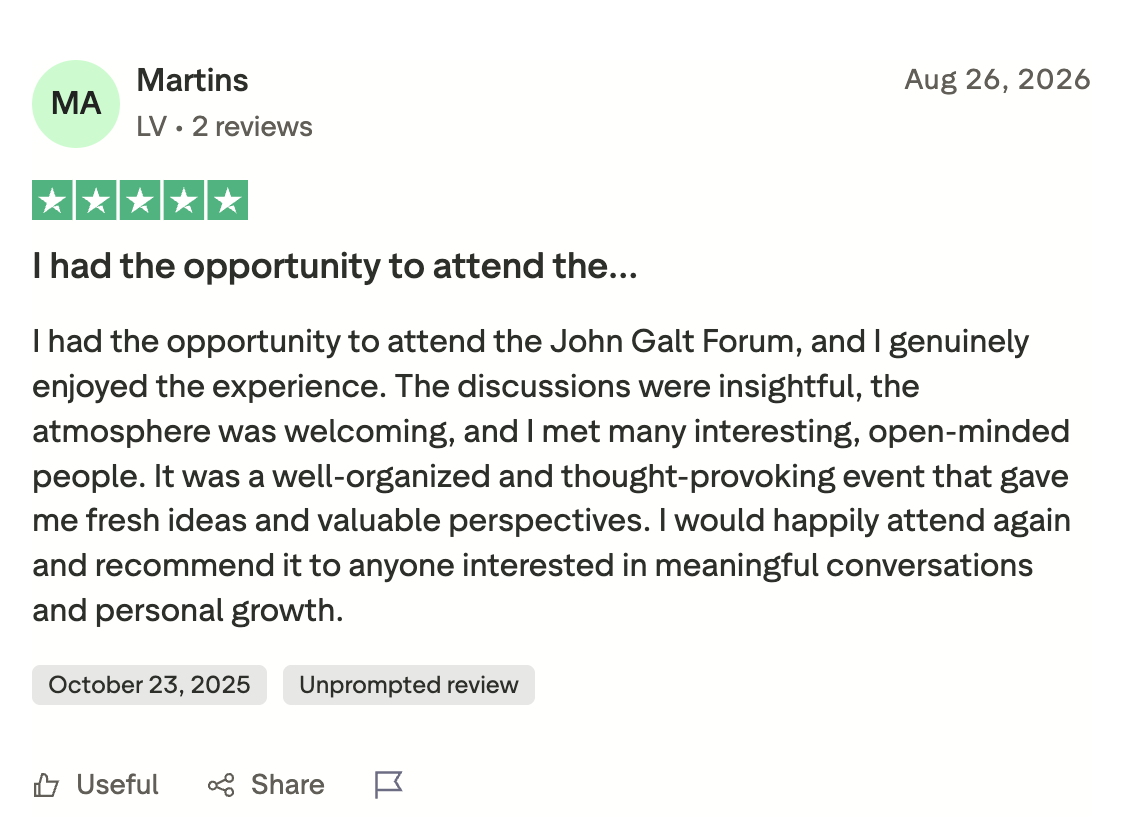
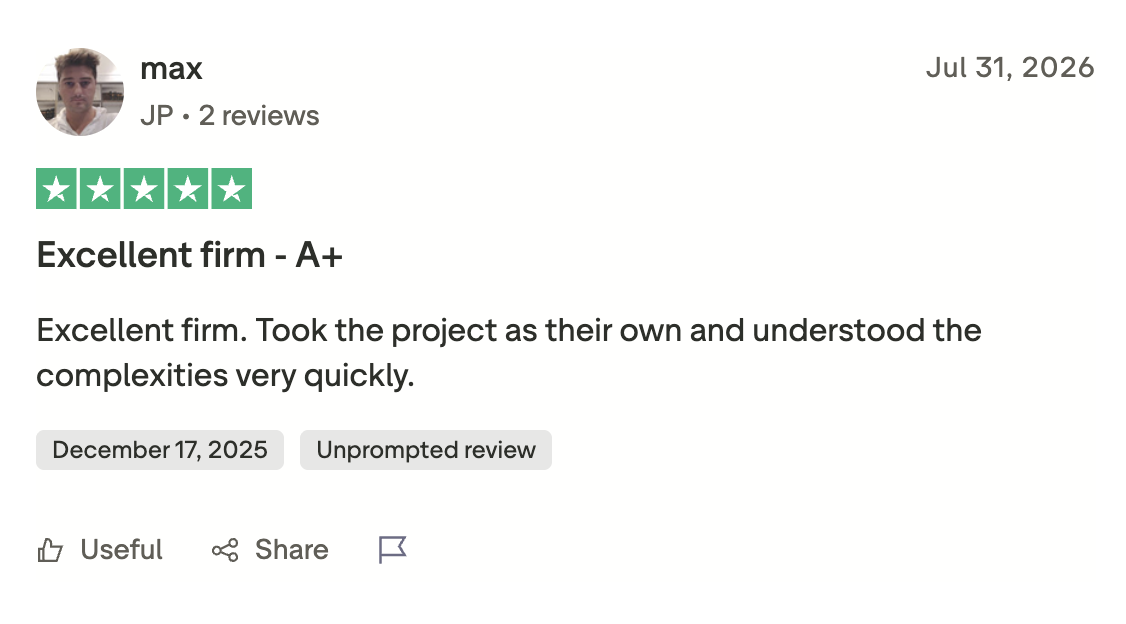
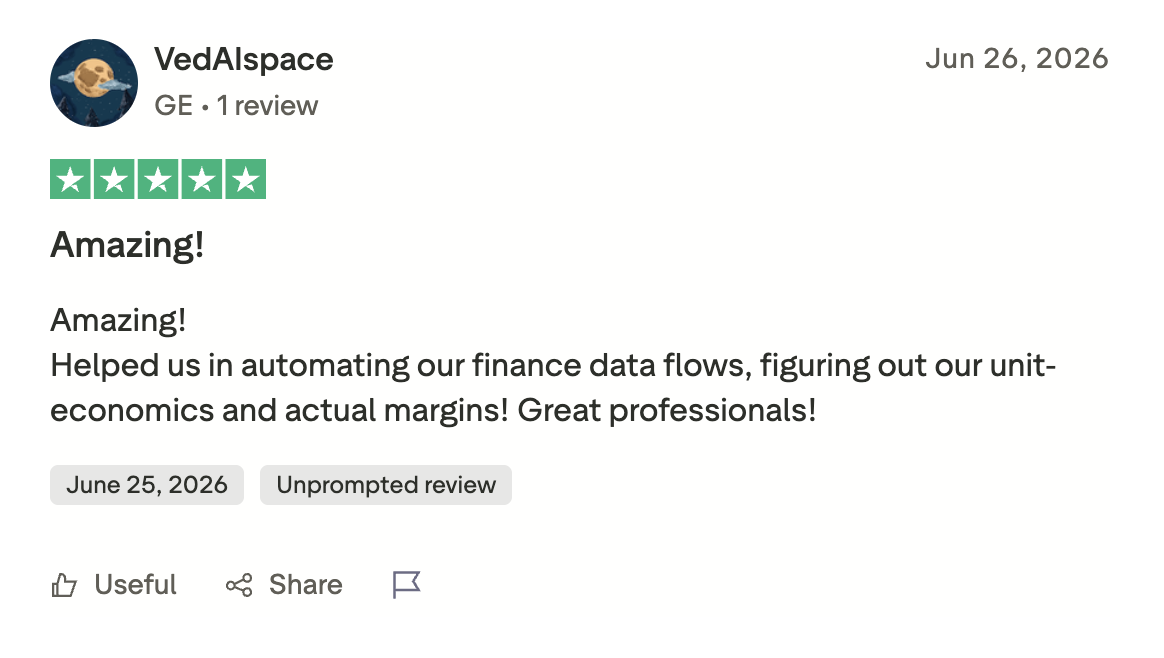
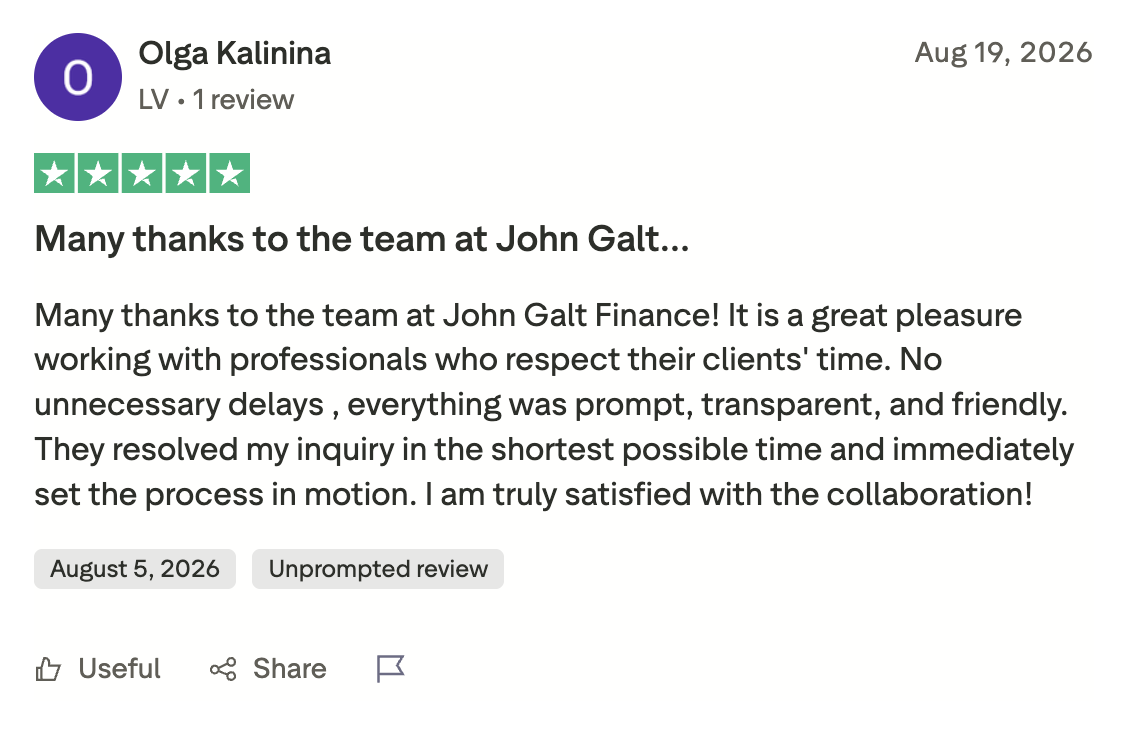
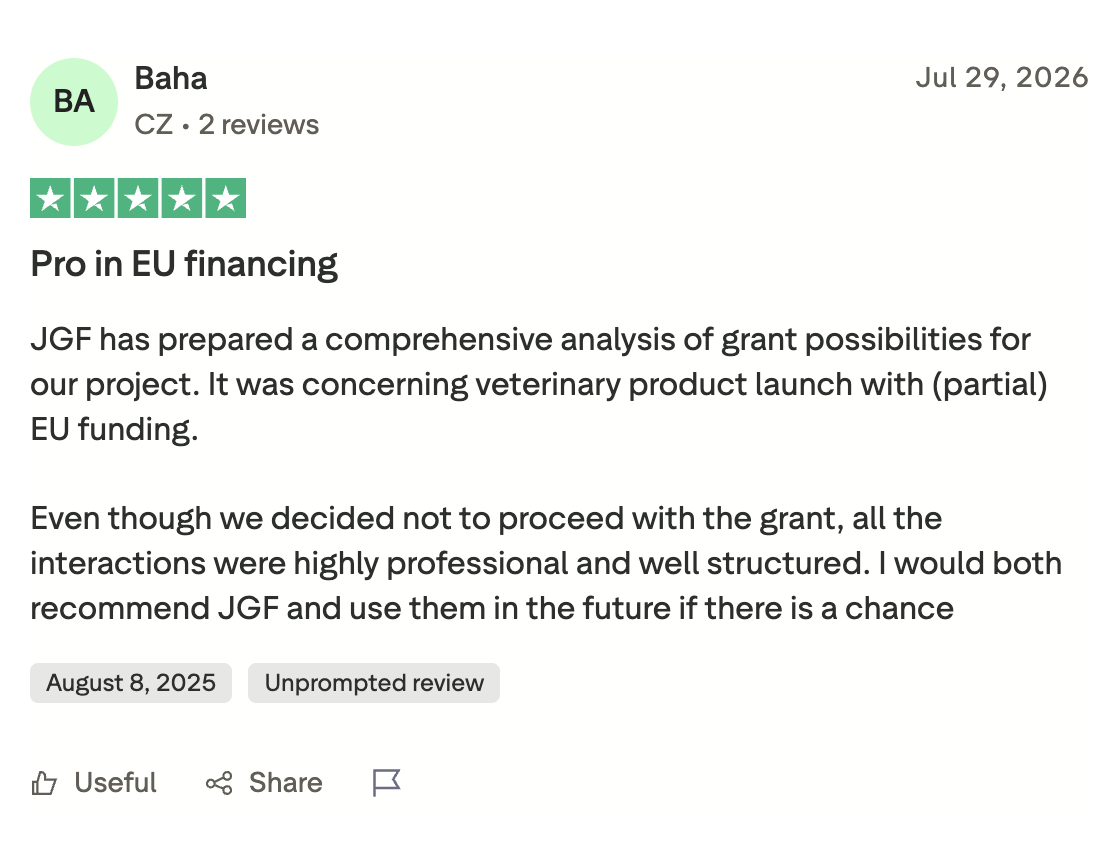
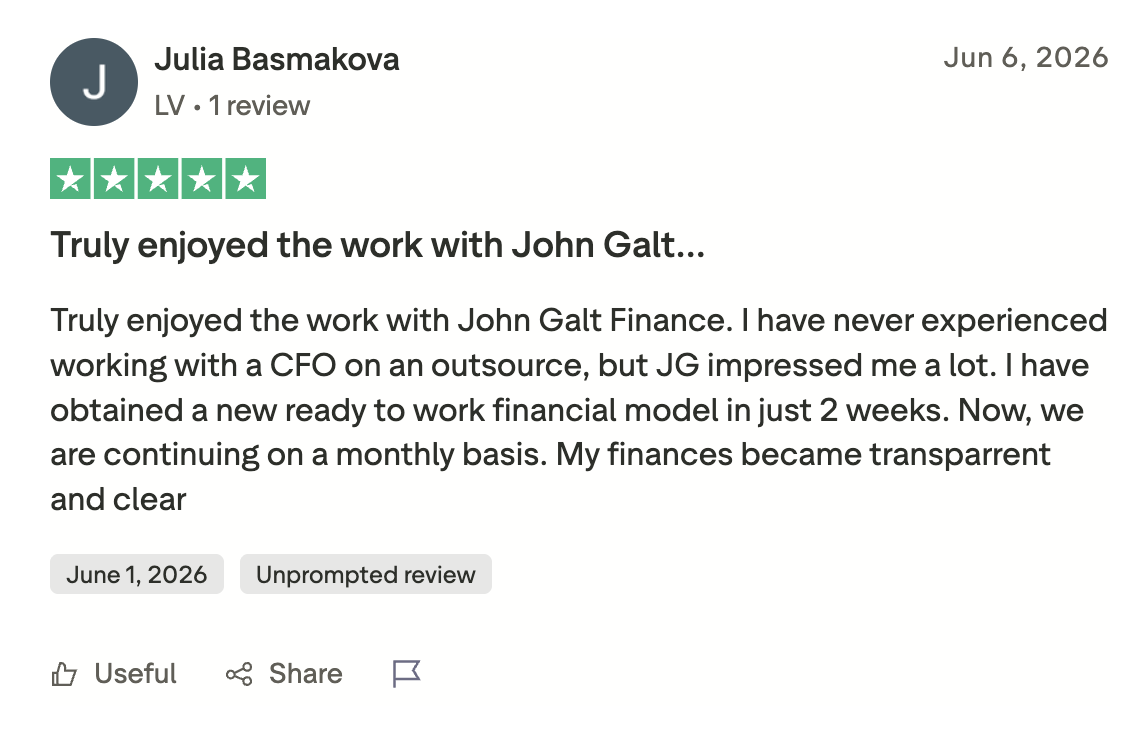
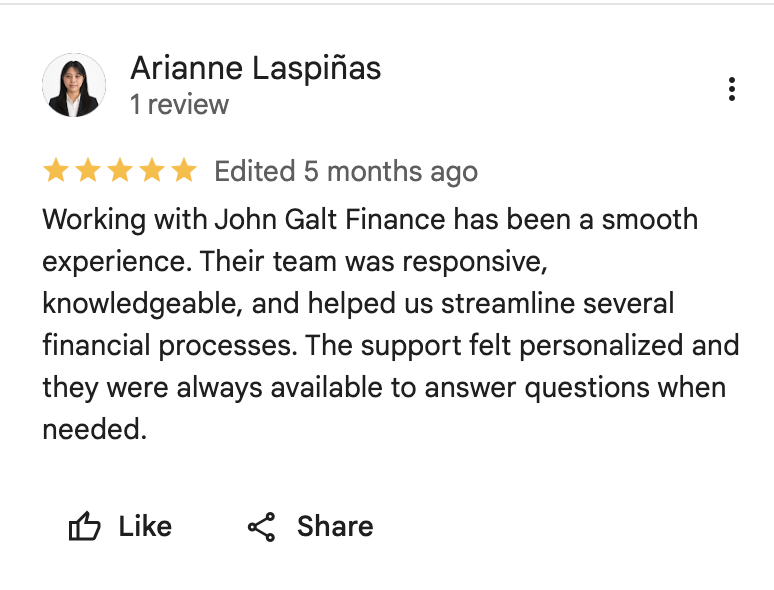
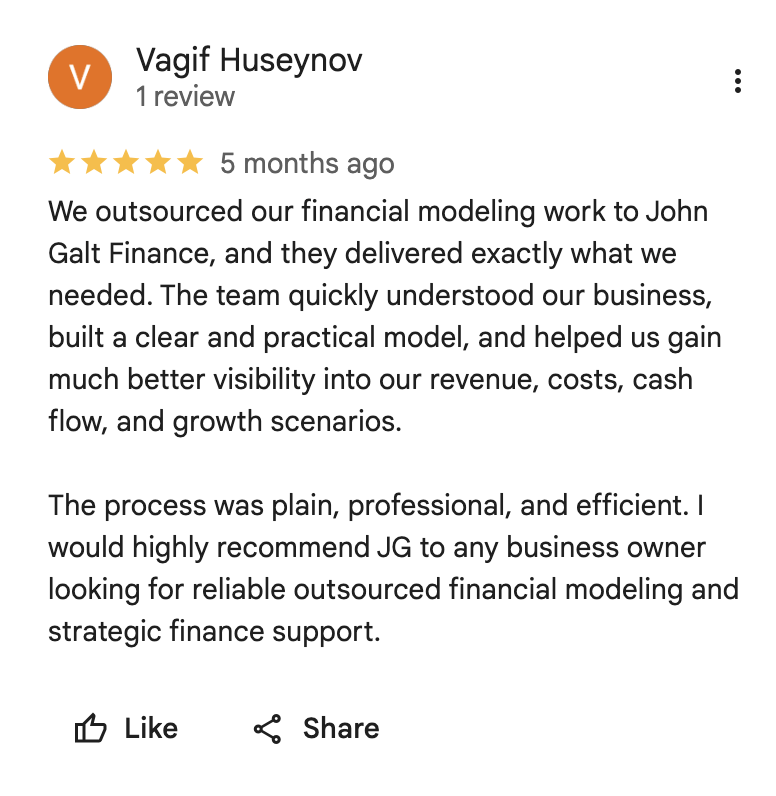
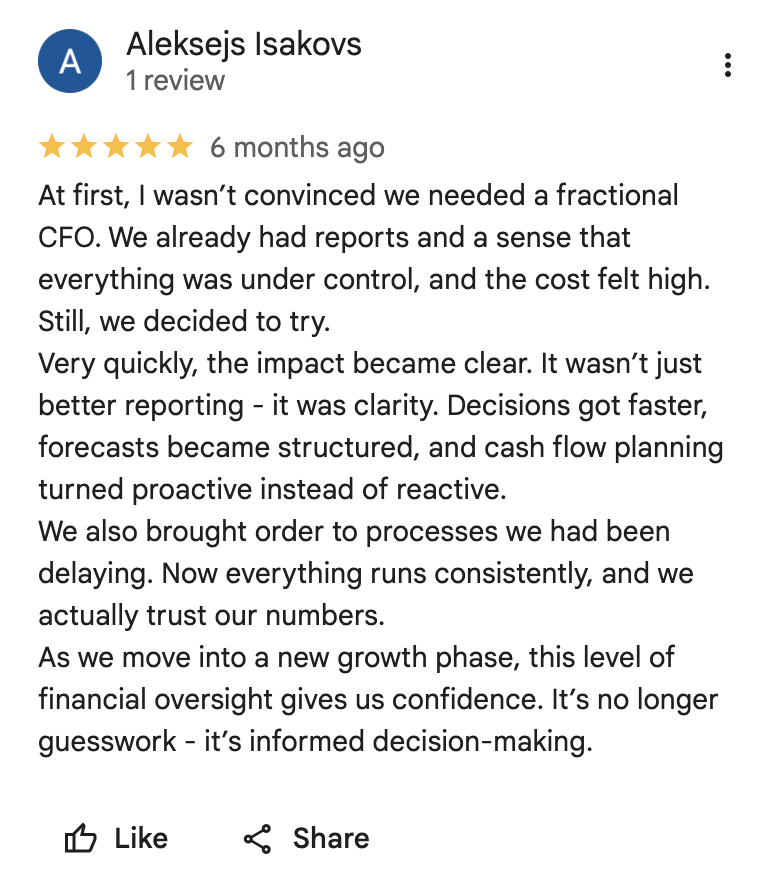
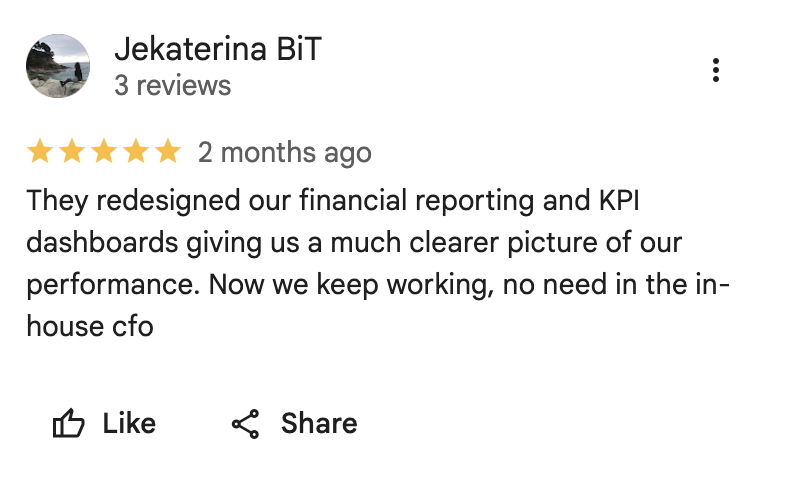
What our clients actually say.



Stop guessing. Start deciding on facts.
A free 30-minute call with a senior CFO. No sales pitch – just a clear read on where your money is and what to do next.
30 min · No pitch · A real CFO, not a chatbot